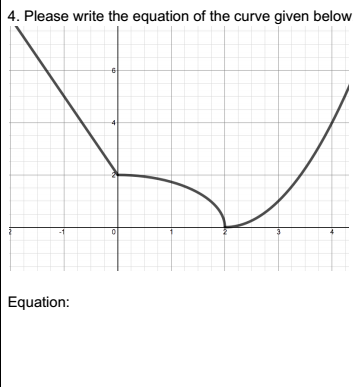
To find the equation of this graph I first found the equation of each line. The equation of the the line that is x< or equal to 0 is y=-2x+2. The equation of the quarter circle that is y=the square root of 4-x^2 if 0 <x<2.The equation for the line that is x> or equal to 2 is y=(x-2)^2.
First, we graphed the function y=x^2 which is the parabola facing upwards on the first picture. Next we found the inverse of the function. To get the inverse you first switch the x's and y's so you get the equation x=y^2. Next you square root both the x and y to get rid of the ^2. I ended up with y=plus or minus the square root of x. Then, I graphed but of those equations to get the second parabola. After that I graphed the line y=x and drew it as a dotted line and folded the paper in half. As a result the graphs were almost identical to each other (They would be more identical but my drawing skills aren't the best!) Not all functions have inverses that are functions also.The first parabola is a function but its inverses is not because it doesn't pass the vertical line test. On the other hand, there are some functions that their inverses are functions too! For example, the function y=x has an inverse of x=y. Both functions pass the vertical line test.
What these graphs show is my prediction (light blue) of what the graph would look like when we let go of a skateboard from a ramp that was 21in, 14in, and 7in high. At the end of the ramp was a sloped driveway that was measured to 64in. The dots are the actual points of the skateboard as it traveled down the driveway.
My first prediction wasn't close to the actual measurements at all. As the graphs went on I was more accurate with my predictions. What made then less accurate was that I didn't estimate the time as the skateboard fell down the ramp and down the driveway. I made my first estimate time to long to reach its maximum but the rest were better. I knew that the skateboard would reach a maximum bu then would come back down due to the sloped driveway. With this information I was able to come up with a graph. The domain of my first two graphs are [0,37] and for the last graph on the right it was [0,16] The range for my first graph (on the left) was [0,66]. The middle graph's range was [0,55]. The range for the last graph was [0,43]. Each graph had a minimum of zero. Even though they all had the same minimum, they all had different maximums. The maximum for 21in ramp was the highest and as the ramp moved down from 21in to 14in to 7in the maximum decreased with it. The graph rises the fastest when the skateboard hits the driveway because of the speed its gained. It starts to slow when it hits the maximum and rolls backwards on the driveway while decreasing speed. It falls the fastest when it hits it's maximum but then it decreases speed as it continues to roll. The less steep the graph the slower the skateboard is moving. |
AuthorRaquel Smith Archives
April 2015
Categories |